
The RCP and RSP reports Reports and monitoring
Choosing a FIR and a period, reading the tables and their colour key, the benchmarks, "not assessed" and "indicative", the graphs, the custom graph, exports, and the Rules page behind every figure.
The reports turn your uploaded rows into the figures of the regional report layout: the share of CPDLC transactions and ADS-C reports that met the RCP 240 and RSP 180 limits, per media and per operator and aircraft type, for one FIR and one period. Every figure is computed from your rows under a published set of rules, the Rules page, and every page says which rules it used.
Choosing a FIR and a period
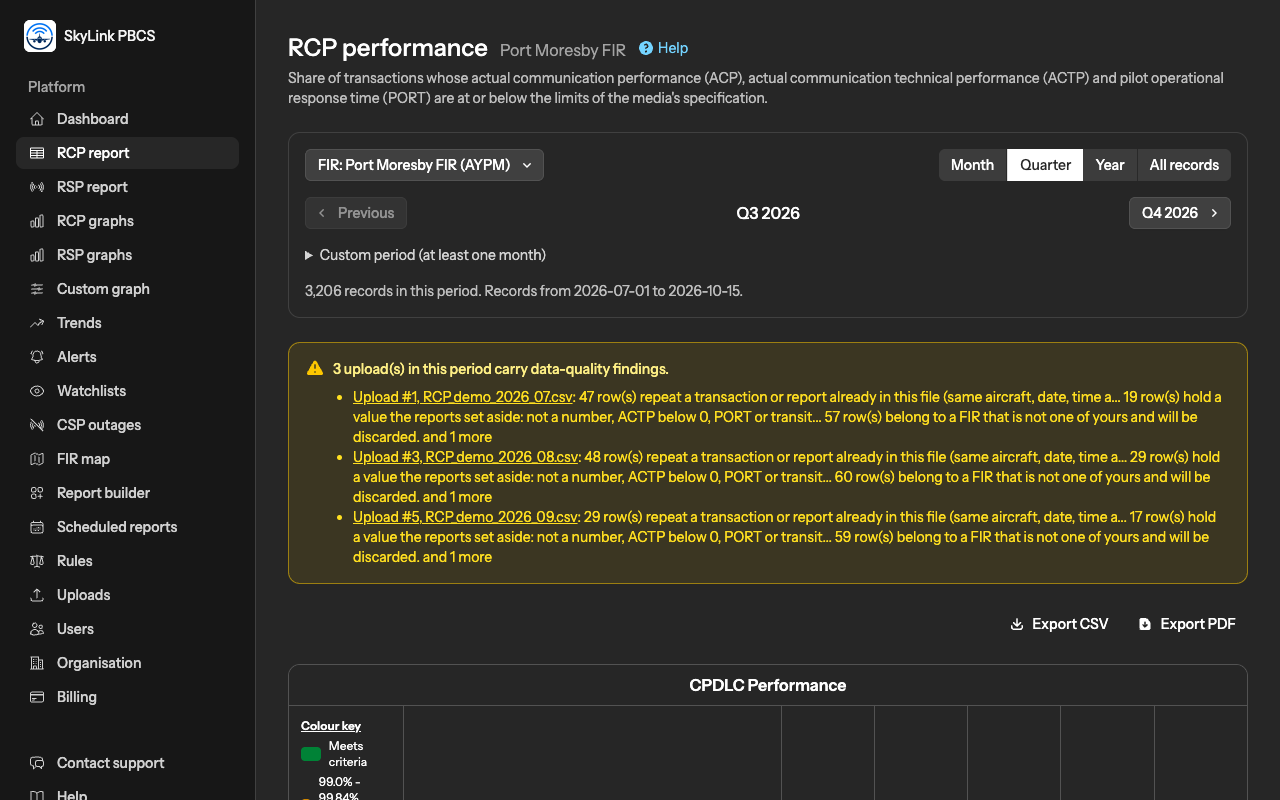
Each report page shows one FIR at a time; the FIR control at the top lists the FIRs of your plan. The period is a month, a quarter, a year, all records, or a custom period of at least one month; the arrows move one period back or forward, and a page opens on the quarter that holds your latest record, so it is never blank when data exists. The dashboard, the map and the monitoring pages use the same FIR and period controls and show the same figures for the same selection.
The tables
The RCP page shows the CPDLC performance table, the RSP page the ADS-C performance table, both in the layout of the regional reports: a line per media type, an All media line, and a section per operator and aircraft type.
| Column | RCP 240 (satellite and VHF) | RSP 180 (satellite and VHF) |
|---|---|---|
| Message count | the transactions measured | the reports measured |
| ACTP, the technical part of the transaction | within 120 s for 95%, within 150 s for 99.9% | |
| ACP, the whole transaction | within 180 s for 95%, within 210 s for 99.9% | |
| PORT, the pilot's response time | within 60 s for 95% | |
| ASP, the report delivery time | within 90 s for 95%, within 180 s for 99.9% |
HF lines are judged against RCP 400 and RSP 400 instead: ACP within 320 s and 370 s, ACTP within 260 s and 310 s, ASP within 300 s and 400 s. A mixed-media transaction is a category of its own and part of the All media line, judged against the 240 and 180 limits, as the regional reports judge their All rows.
Each cell holds the share of records within the limit and the number of records it rests on.
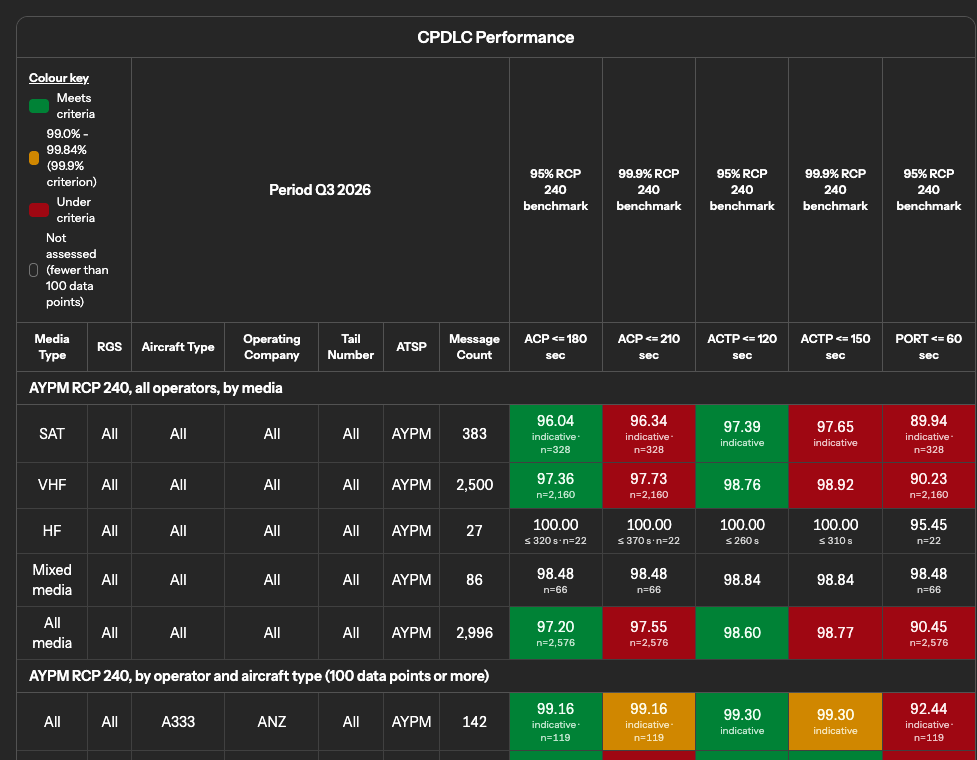
The colour key
- Green, meets: the share is at or above the criterion, judged on the unrounded value. For the 99.9% criterion the reports are read at one decimal, so a share meets it from 99.85%.
- Amber, marginal: for the 99.9% criterion only, a share between 99.0% and 99.84%, the yellow band of the regional report template. The 95% criterion has no band.
- Red, under: below the criterion, or below the band where one exists.
- Grey, not assessed: fewer than 100 records in the group. A share is still shown when it rests on at least 100 records, and carries the word indicative below 1,000 records.
An operator or aircraft type appears in its section only when it has at least 100 records in the period; choose a longer period to see more of them.
How the rows were prepared
Under each table, How the rows were prepared says what became of your rows before measuring, so that the counts in the table can be followed back to the uploads:
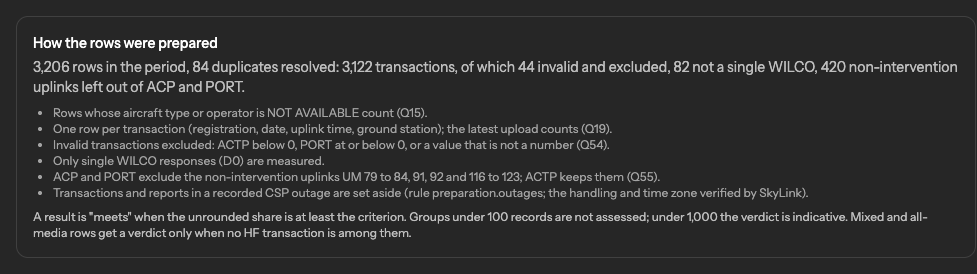
- Duplicates: one row per transaction (registration, date, uplink time, ground station) or per report (registration, date, aircraft time, position); when a file was uploaded again, the latest upload counts.
- Invalid values, set aside: ACTP below 0, PORT or a transit time at or below 0, a value that is not a number.
- Responses other than a single WILCO: only uplinks answered by a single WILCO are measured.
- Non-intervention uplinks: ACP and PORT measure intervention transactions only; the non-intervention uplink messages are left out of those two, and kept for ACTP.
- CSP outages: when your organisation's handling of outages is verified, the transactions and reports that fall in a recorded outage are set aside before measuring, and the line says how many; see CSP outages.
- NOT AVAILABLE as aircraft type or operator does not exclude a row: it counts, without a type or operator.
The data-quality findings of each upload announce these counts before the import; the table confirms them after.
The graphs
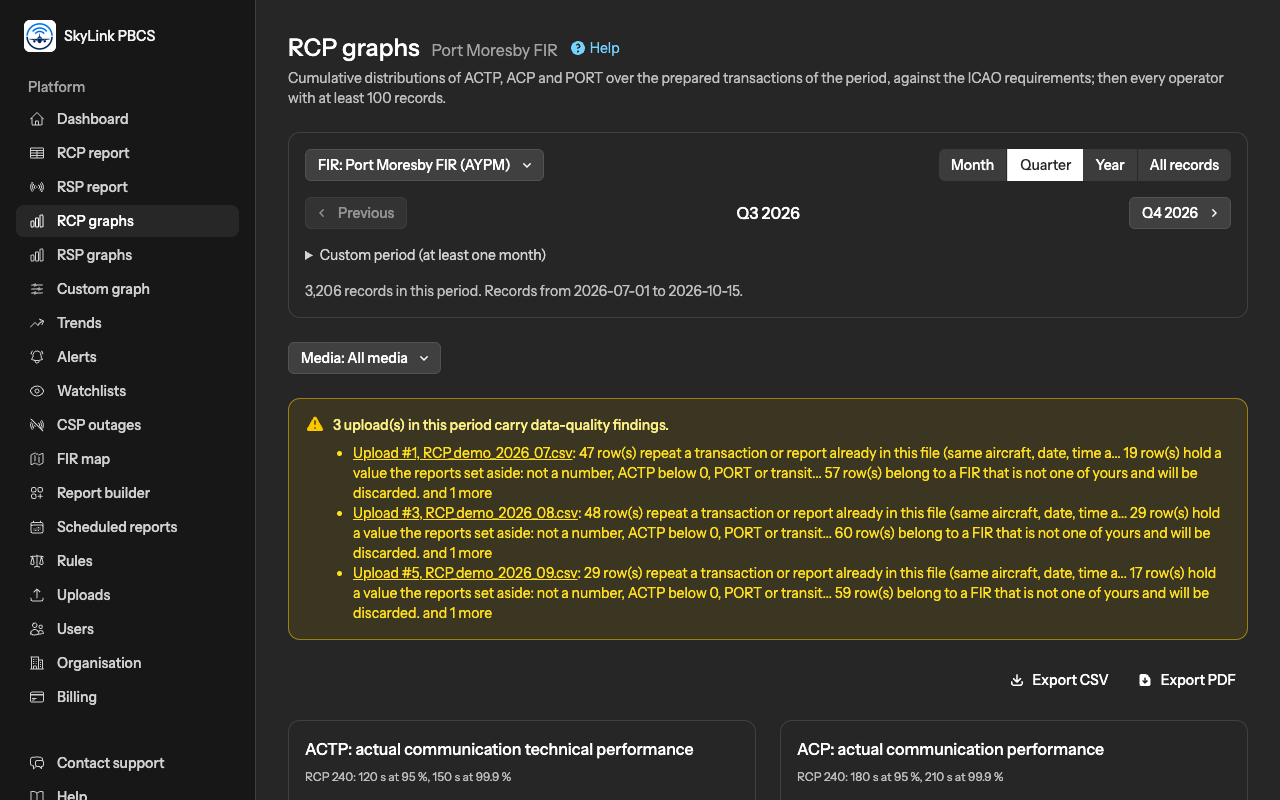
The graph pages draw, for the same FIR and period, the cumulative distribution of each measure: the share of transactions or reports delivered within a time, for every time between 50 and 240 seconds. The dashed red line is the requirement at the specification: a curve meets it when it passes above the corner. The figure beside each curve is the share at the limit. Every valid value counts in a curve, including those beyond the window shown.
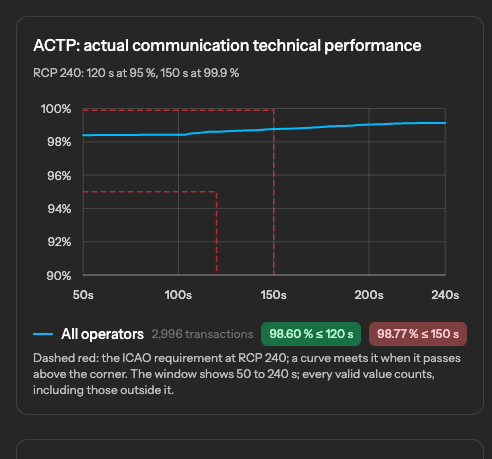
The RCP page draws ACTP, ACP and PORT for all operators, then ACP and ACTP per operator for every operator with at least 100 records; the RSP page draws ASP for all operators and per operator and aircraft type. The curves and the tables are computed from the same prepared rows, so a share read from a curve at its limit equals the share in the table.
The custom graph
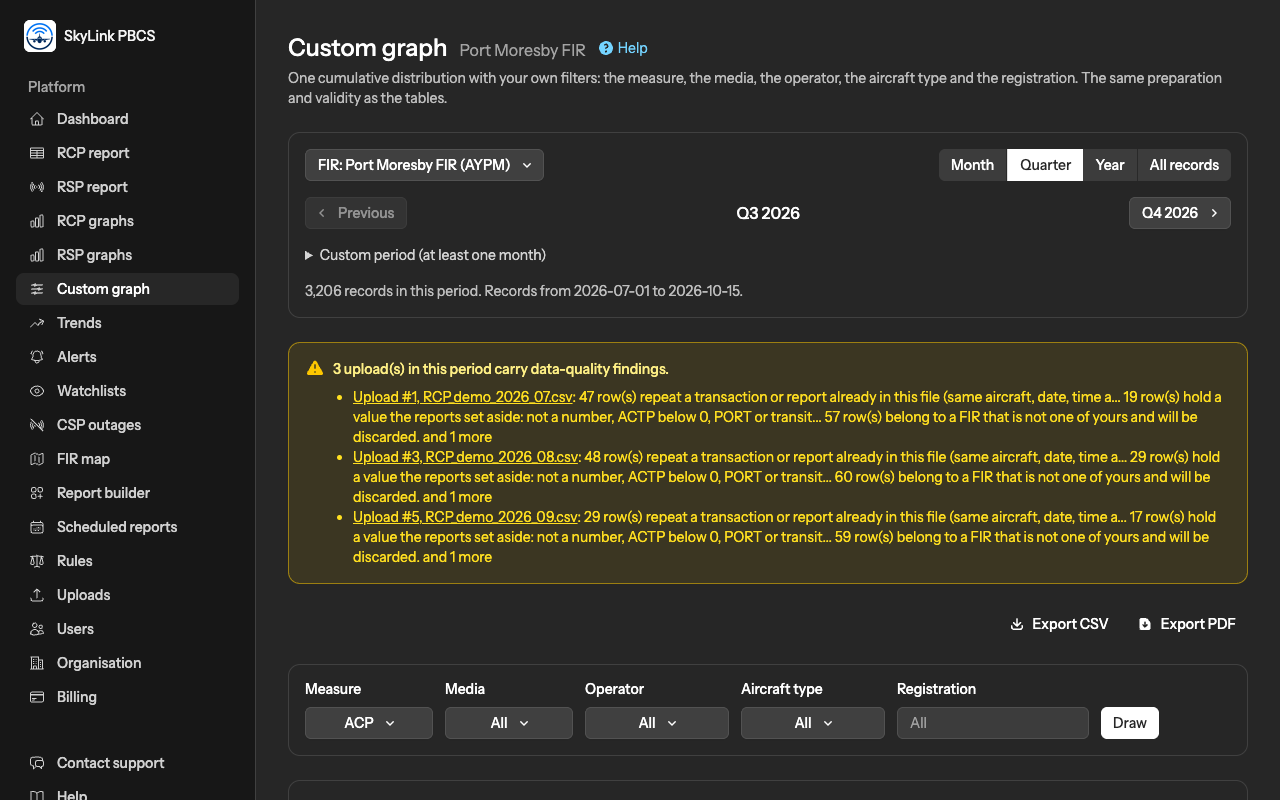
The custom graph draws one measure, ACP, ACTP or PORT, for a selection of your choice: a media type, an operator, an aircraft type, a single registration, or any combination, over the FIR and period of the page. It is the quickest way to look at one aircraft or one airline against the limits. A selection with fewer than 100 records is drawn but marked as not assessed.
Exports
Export CSV on a table page downloads the table as it is shown, for the same FIR, period and computation; Export PDF downloads it as a document with the colour key, the preparation and the rules note. The graph pages and the custom graph export the points of their curves as CSV and the charts as PDF, with the same note. Exports are for Editors and Admins, and are limited to a reasonable number per minute. For a report that arrives by email on a schedule, see Scheduled reports.
The Rules page
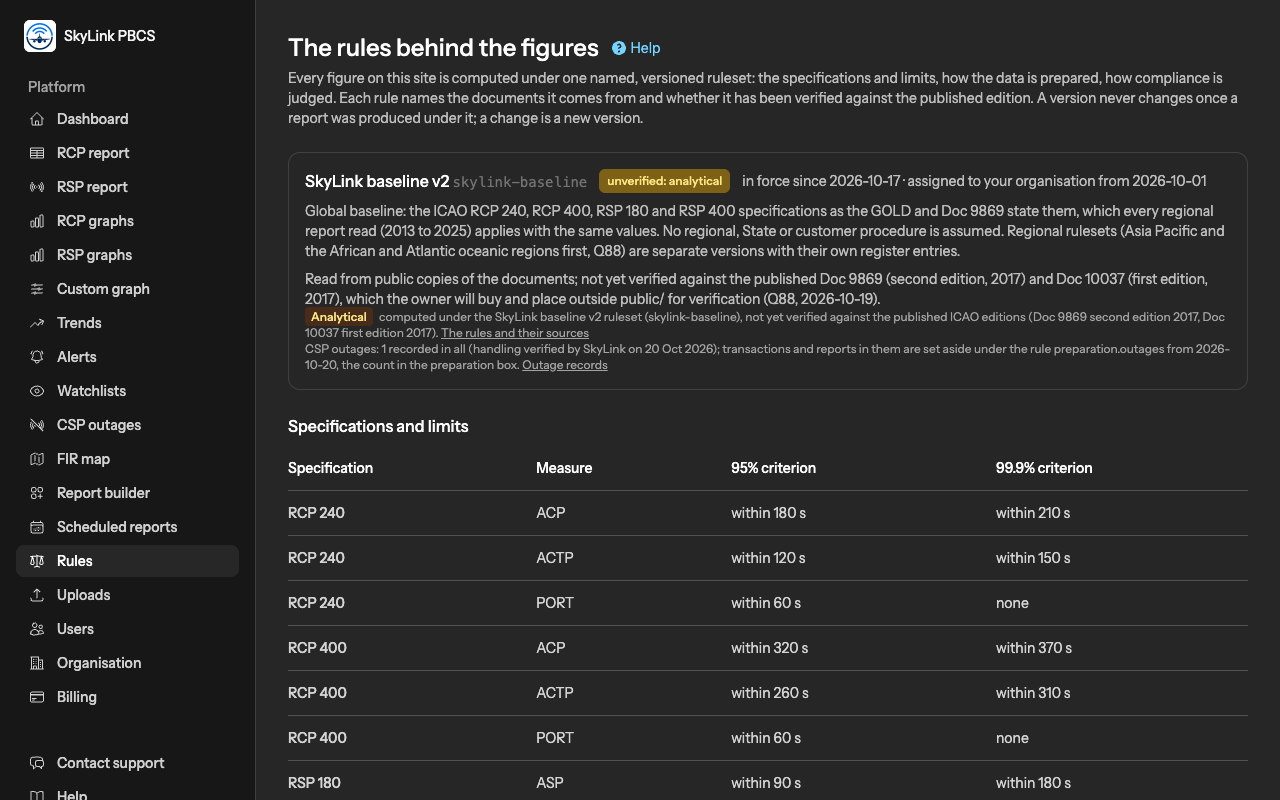
Every figure rests on a ruleset: the specifications and their limits, the criteria and the bands, how the rows are prepared, when a group is assessed, and how an aircraft is flagged. The Rules page shows the ruleset that applies to your organisation, rule by rule, each with the document and section it was read from, and a register of those documents with their editions. The status of each rule says whether it has been verified against the published edition.
The "Analytical" label
Until a rule has been verified against the published ICAO editions, every page and every export that uses it carries the label Analytical, with a sentence naming the ruleset and its status. It means: computed under the rules as we read them from public copies, not yet checked against the published documents. The figures are the same before and after verification unless the check finds a difference; the label tells you which is the case. The regional reports you file remain your own: SkyLink's tables are an aid to prepare and check them, not the report itself.
When a figure surprises you
- A share that differs from your own calculation usually comes from the preparation: duplicates, invalid values, the single-WILCO rule or non-intervention uplinks. The box under the table gives the counts; the data-quality article explains each.
- A group that was in last month's report and is missing now has fewer than 100 records in this period; choose a longer period.
- A line that reads "not assessed" is not a failure: it is a group too small to judge.
- Two pages that disagree for the same FIR and period would be a defect; they are built from the same prepared rows. Write to us with the two pages and the period.
Not answered here? Write to us.