
Monitoring Reports and monitoring
The dashboard, trends, alerts, watchlists, the FIR map, the report builder and scheduled reports: the tools that watch your figures between two reports.
The report pages answer "what were the figures for this FIR and period". The monitoring pages answer the questions around them: how the figures move, which aircraft or operator keeps falling short, what changed since the last file, and how to get a report without opening the site. All of them read the same prepared rows as the tables, so a figure never differs from one page to another for the same FIR and period.
The dashboard
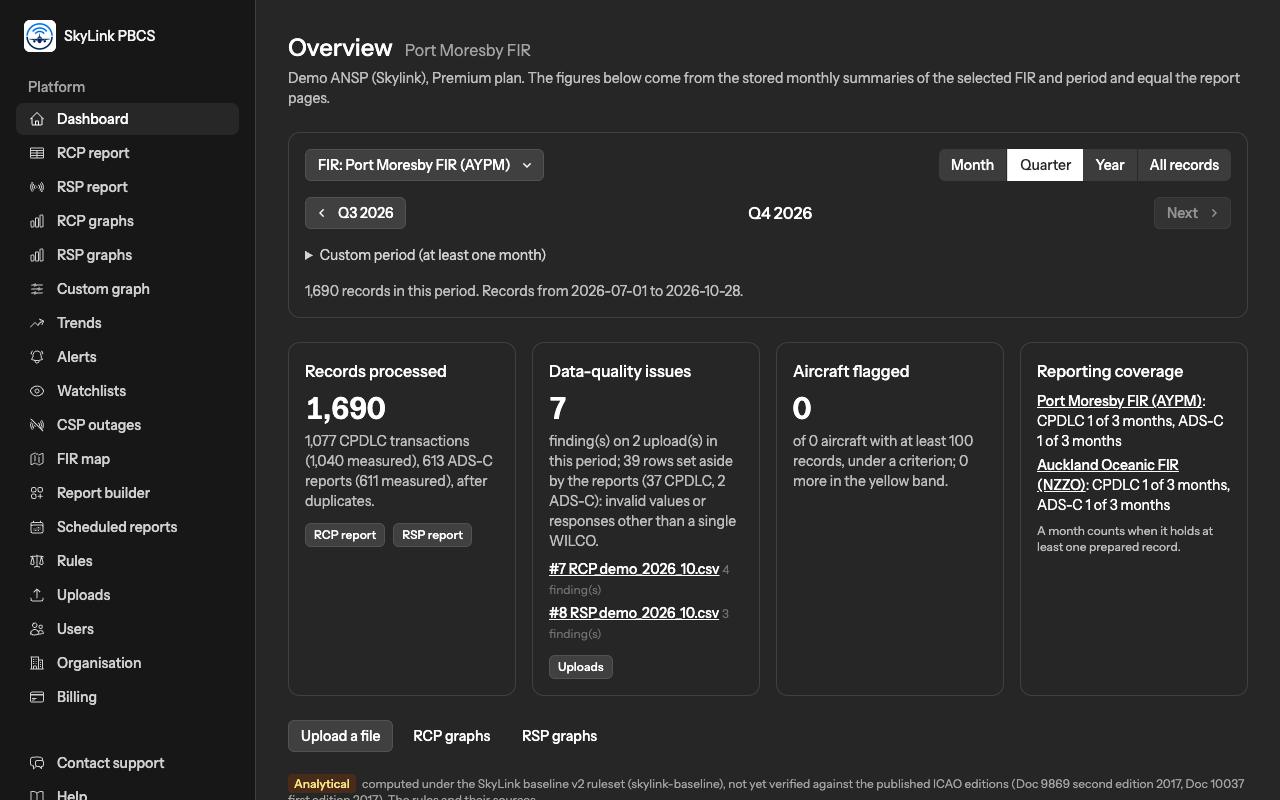
The dashboard opens on the quarter that holds your latest record. Its four tiles summarise the selected FIR and period:
- Records processed: the CPDLC transactions and ADS-C reports in the period, how many were measured, after duplicates.
- Data-quality issues: the findings of the period's uploads and the rows the reports set aside, with a link to each upload; see Data quality.
- Aircraft flagged: the aircraft with at least 100 records that are under a criterion, and how many more sit in the marginal band.
- Reporting coverage: for each of your FIRs, how many months of the period hold at least one prepared record, per dataset.
While the data setup is unfinished, a notice at the top says so and no outage exclusion is applied.
Trends
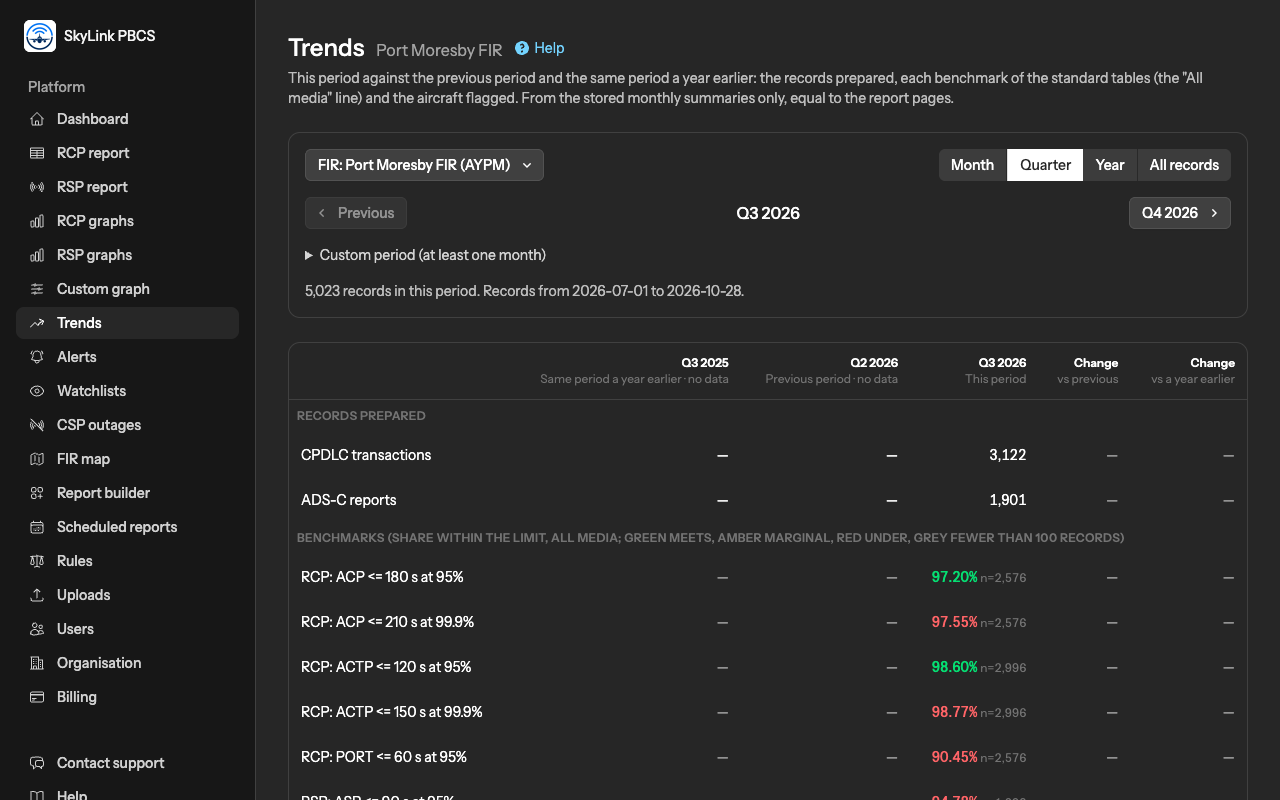
Trends puts the selected period next to the previous one and to the same period a year earlier: the records prepared, every benchmark of the standard tables on the All media line, and the aircraft flagged. The change is in percentage points; green is an improvement. A period without data shows no figure and no change, and "all records" has nothing to compare with. The colours are those of the tables: green meets, amber marginal, red under, grey fewer than 100 records.
Alerts
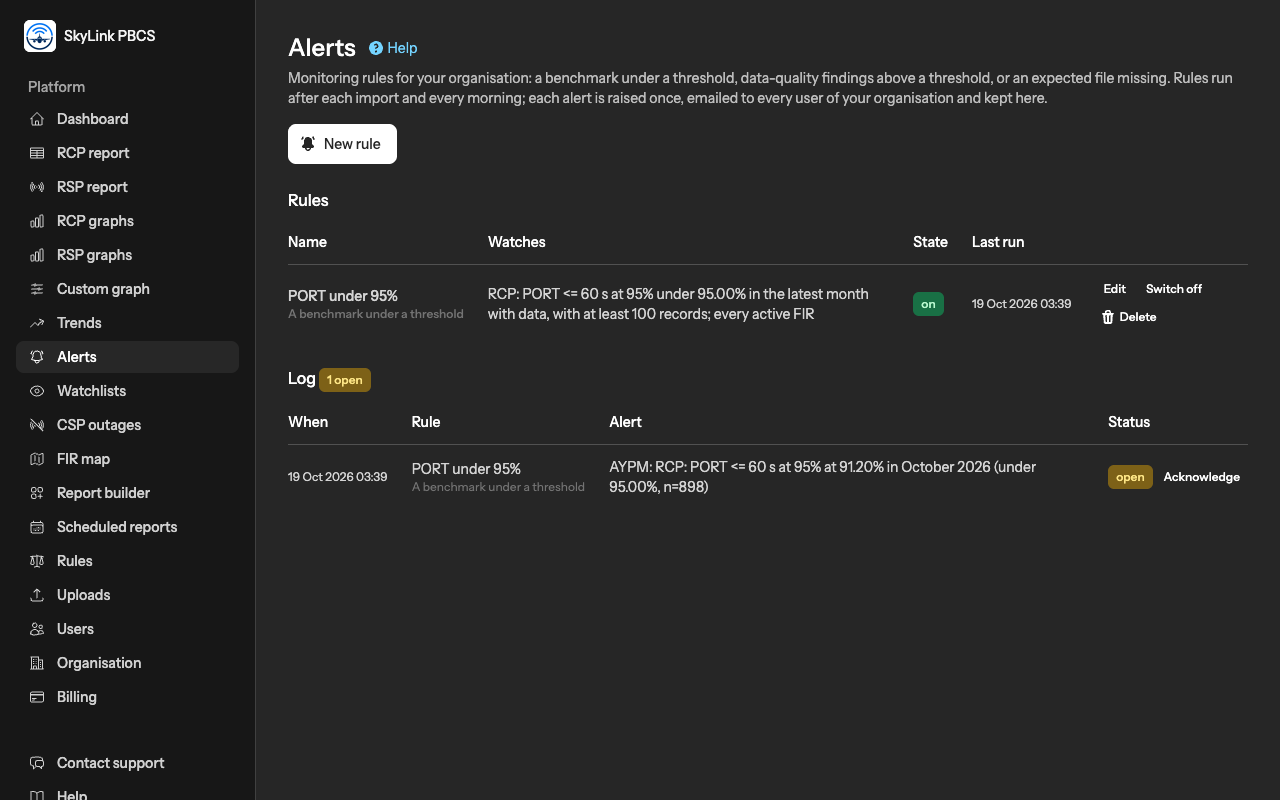
An alert rule watches something and tells every user of your organisation by email when it happens; each alert is raised once for what it is about and kept in the log, where it can be acknowledged. Rules run after each import and every morning. An Editor or an Admin creates them. Three kinds exist:
| Rule | What it watches |
|---|---|
| A benchmark under a share | A benchmark of the tables, in the latest month with data of each FIR, on the All media line, under the share you set, judged only with at least the number of records you set (100, as on the tables); one alert per month and FIR. The criterion is the natural value: 95 or 99.9. |
| Too many findings in a file | The data-quality findings of an import, more than a number per 100 rows; one alert per file. |
| A file that does not arrive | The previous month has no data for the FIR by the day of the month you set; one alert per month and FIR. |
A rule can be switched off and on, or deleted; its past alerts stay in the log.
Watchlists
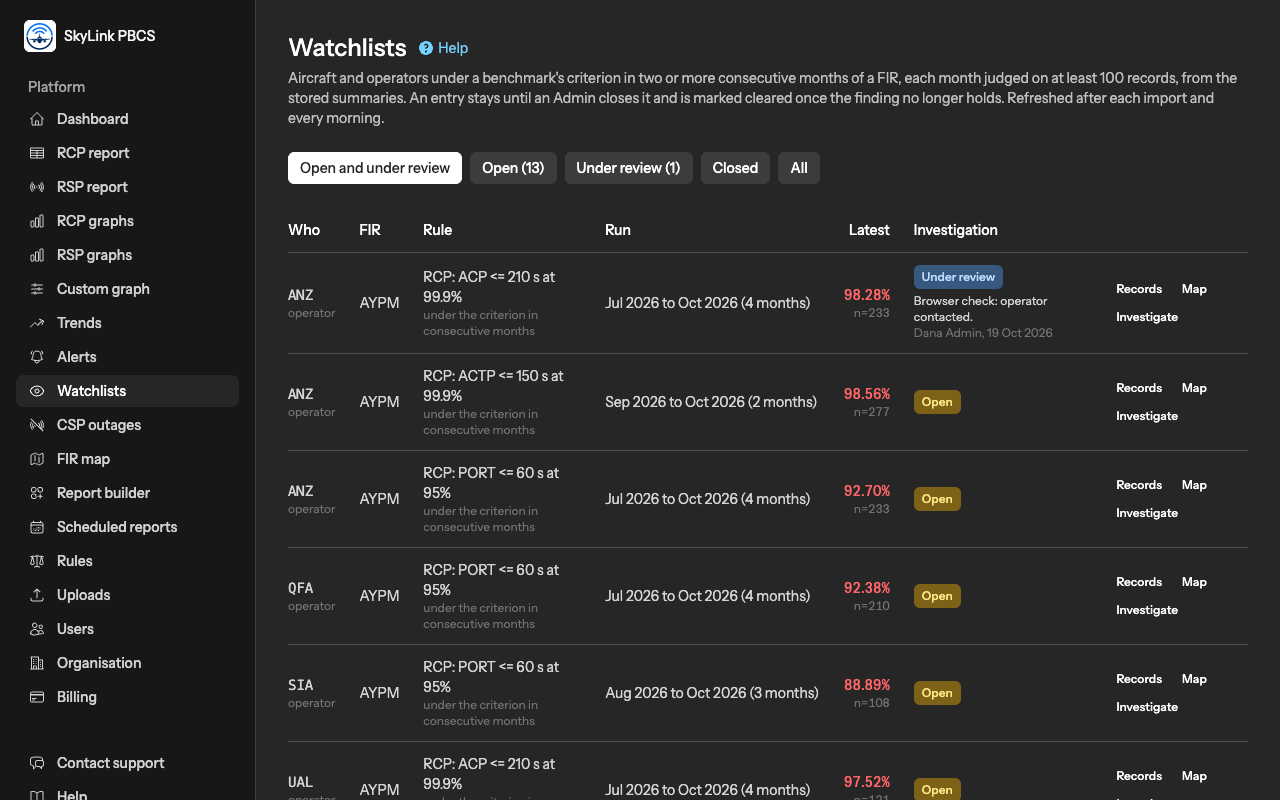
An aircraft or an operator enters a FIR's watchlist when it is under a benchmark's criterion in two or more consecutive months, each month judged on at least 100 of its records. The list shows the run of months, the latest figure and the records behind it. It is refreshed after each import and every morning.
Investigate opens the entry: an Admin sets its status, under review or closed, and writes notes, what was found, what was done. An entry that is no longer under the criterion is marked cleared from the first later month in which the finding no longer holds; a closed entry stays in the history.
The FIR map
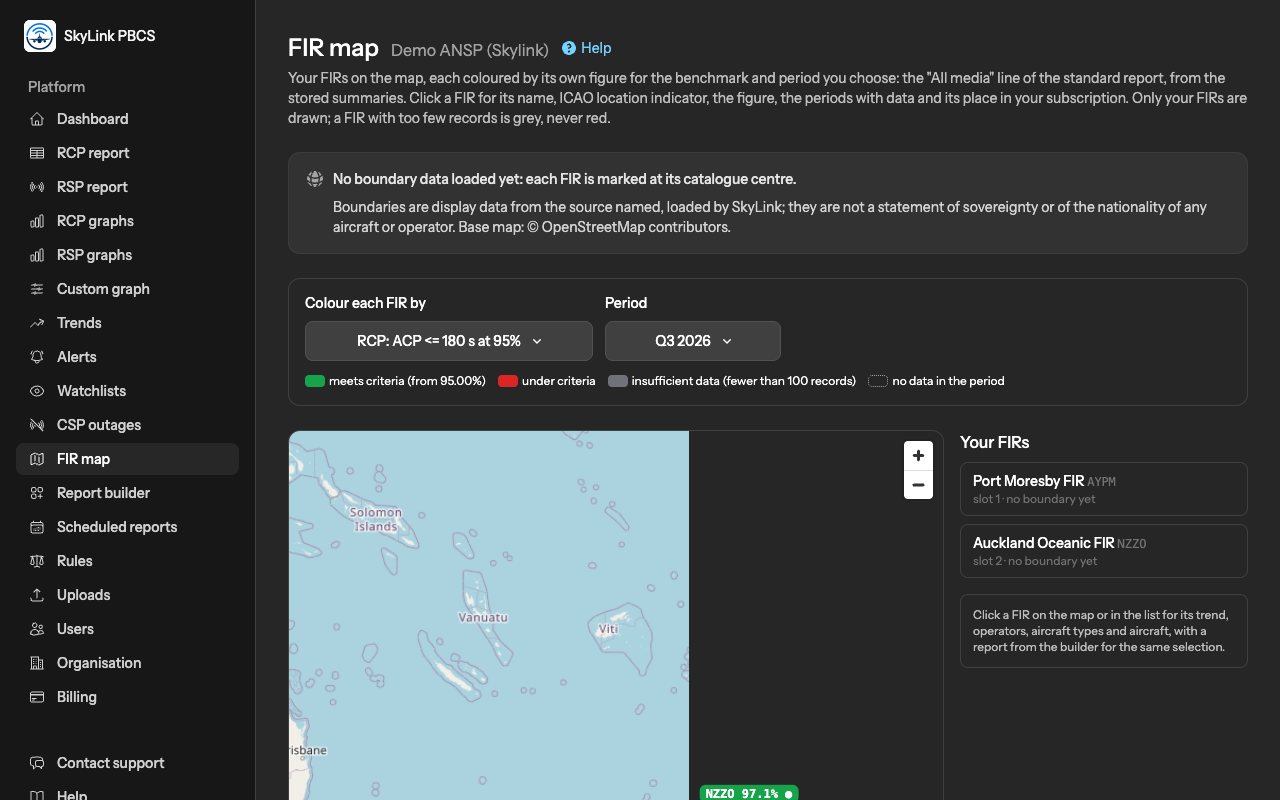
The map shows your FIRs on a base map and colours each by its own figure for the benchmark and period you choose, the All media line of the standard report: green meets the criterion, red is under it, grey has fewer than 100 records, and an empty outline has no data in the period. A FIR with too few records is grey, never red. Click a FIR on the map or in the list for its name, its figure, the periods with data, its trend, its operators, aircraft types and aircraft, with a report from the builder for the same selection. A FIR whose boundary is not yet in our catalogue is marked at its centre until the boundary data is loaded; boundaries are display data and say nothing about sovereignty.
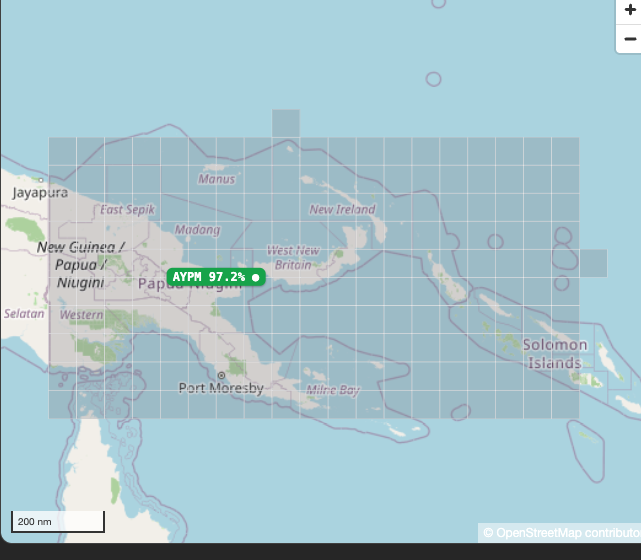
Problem areas. Choose Problem areas of one FIR under Show, and the map draws that FIR's ADS-C reports of the period in cells of one degree of latitude and longitude. Each cell is coloured by its own share of reports within the limit of the RSP benchmark you choose, judged with the ruleset's criterion and bands exactly as the RSP table judges its lines; a cell with fewer than 30 measured reports is grey, and reports without a usable position are counted apart and drawn nowhere. Hover a cell for its reports, the share, the mean and 95th percentile delay and the split by media. The specification, media and report-type filters narrow the reports. A report is placed where the aircraft was when it reported, not where the delay arose: the layer is a local presentation, and ICAO defines no map.
The report builder
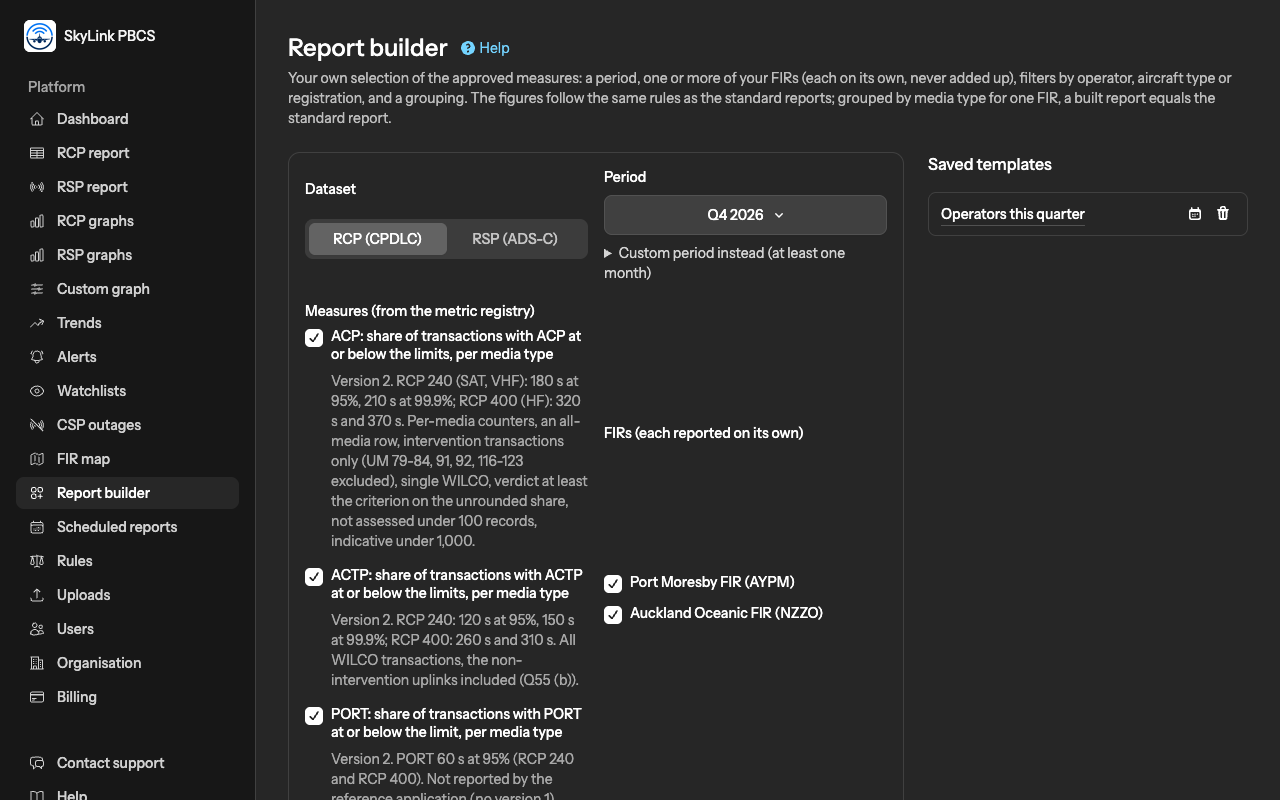
The builder makes a table you define: one dataset, RCP or RSP; one or more measures from the registry; a period or a custom period of at least one month; one or more FIRs, each reported on its own, never summed; a grouping: none, one line per FIR; media type, as the standard report; operator; aircraft type; operator and aircraft type; aircraft, by registration; or month; and filters by operator, aircraft type or registration. Where SkyLink has verified your outage handling, you choose whether rows in recorded outages are set aside under the rule, as the standard reports do, or counted. The result is on the page and exports as CSV or PDF, and can be saved as a template to run again later, or scheduled.
Scheduled reports
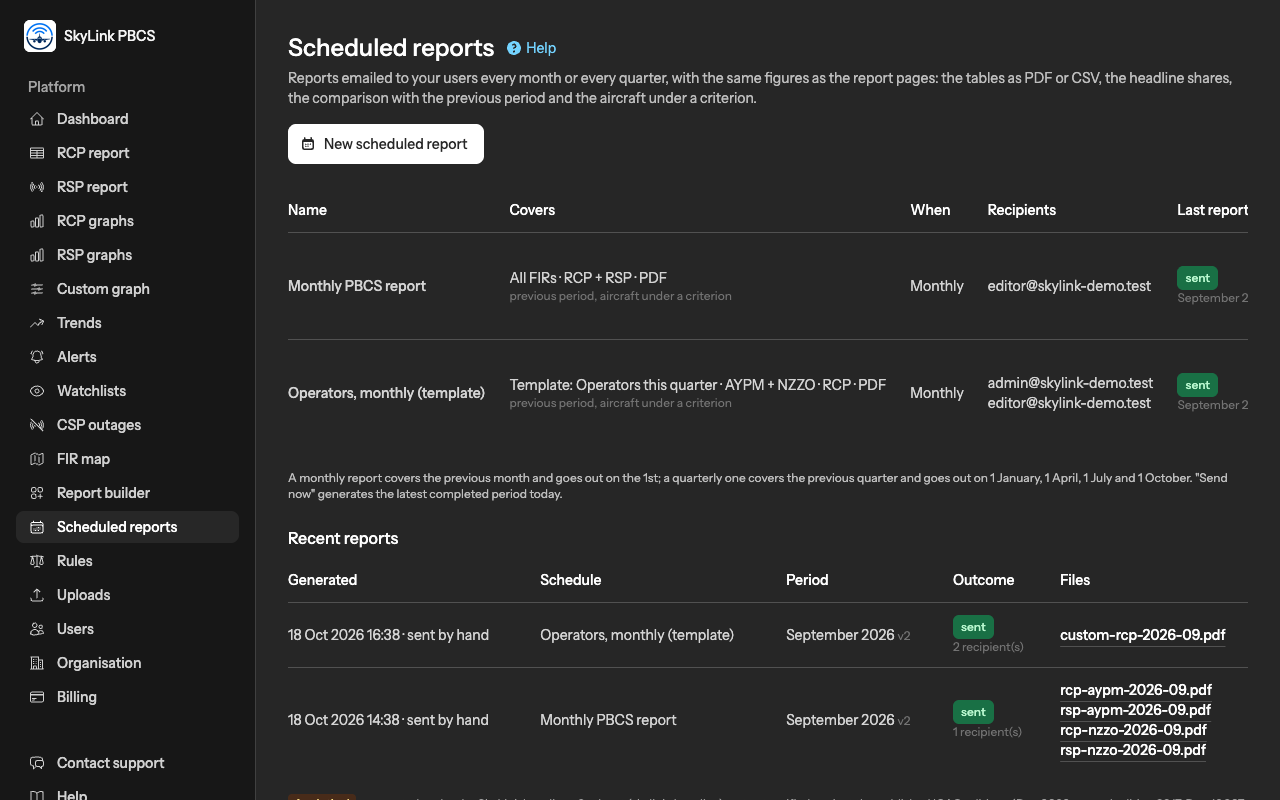
A scheduled report is sent by email without anyone opening the site. An Editor or Admin creates one: the standard tables of one FIR or of every active FIR, or a template of the builder; RCP, RSP or both; monthly, for the previous month, sent on the 1st, or quarterly, for the previous quarter, sent on 1 January, 1 April, 1 July and 1 October; as PDF, CSV or both; to the enabled users of your organisation you choose. The message can also carry the previous period with the change in points, and the aircraft under a criterion or in the marginal band. A report for a period can be sent by hand with Send now, and the recent reports are kept on the page with their outcome. A user disabled later stops receiving it, and a locked or cancelled organisation receives nothing.
Not answered here? Write to us.